Trusted Intelligence for Your Sector
-

Researchers
Explore Research ToolsUnlock logistics datasets for robust analysis: quantify border delays and model corridor performance. Enabling you to streamline your research through custom data extracts.
-

Industry Collective
Discover Your SolutionEmpower members with standardised logistics metrics and comparative analytics. Identify industry-wide bottlenecks, and drive advocacy with independent data insights.
-

Government Bodies
Inform infrastructure investments, policy objectives, and streamline border procedures. Increase transparency and optimise trade facilitation with evidence-based insights.
-

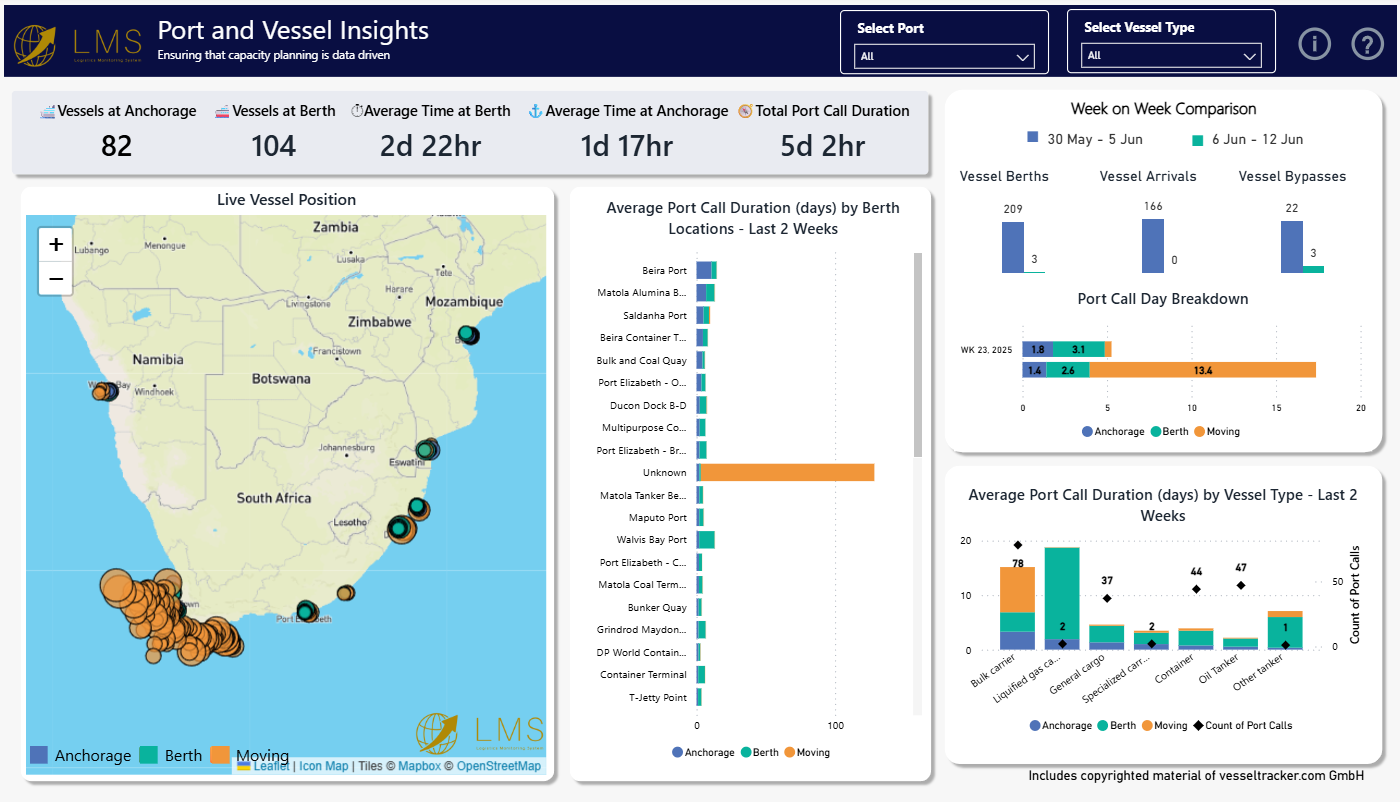
Ports
See Port AnalyticsLeverage near real-time regional port and vessel records, including anchorage and berth analytics to diagnose bottlenecks and unlock capacity needs to optimise port operations.
-

SME's
Start OptimisingTap into historical and near real-time logistics data for smarter routing, delay mitigation, and cost optimisation - no heavy IT setup required.
-

Insurance Providers
Discover Risk InsightsEnhance underwriting with corridor and port specific risk profiles. Use historical incident rates and delay patterns to refine premiums.
-

Funding Partners
See Investment InsightsUse analytics to gauge ROI and track project impact. Support decisions and demonstrate outcomes with data-driven reporting.
-

Allied Services
Integrate into advisory services, projects, or solutions. Use white-label dashboards to add value, deepen offerings, and uncover opportunities.


Coverage
-
Over 70,000 vehicles tracked every day
-

273 884 vessel records received per week
-

68 million recorded Geo zone visits
-

1595 Geo zones monitored daily
-
10 regional ports monitored reported live
-

16 corridors monitored daily
-

51 Borders monitored daily
-

Includes near real-time traffic & weather data


Subscription Options
-
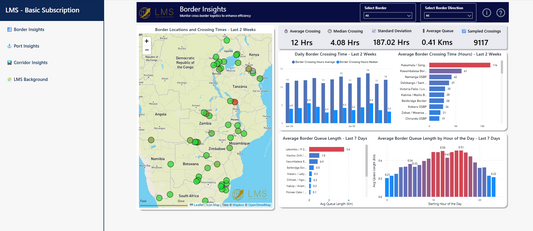
Basic Subscription
Regular price R 349.00 ZAR per MonthRegular priceUnit price per -
Standard Subscription
Regular price R 490.00 ZAR per MonthRegular priceUnit price per -
Premium Subscription
Regular price R 0.00 ZAR per MonthRegular priceUnit price per
Discover Our Solutions:
-
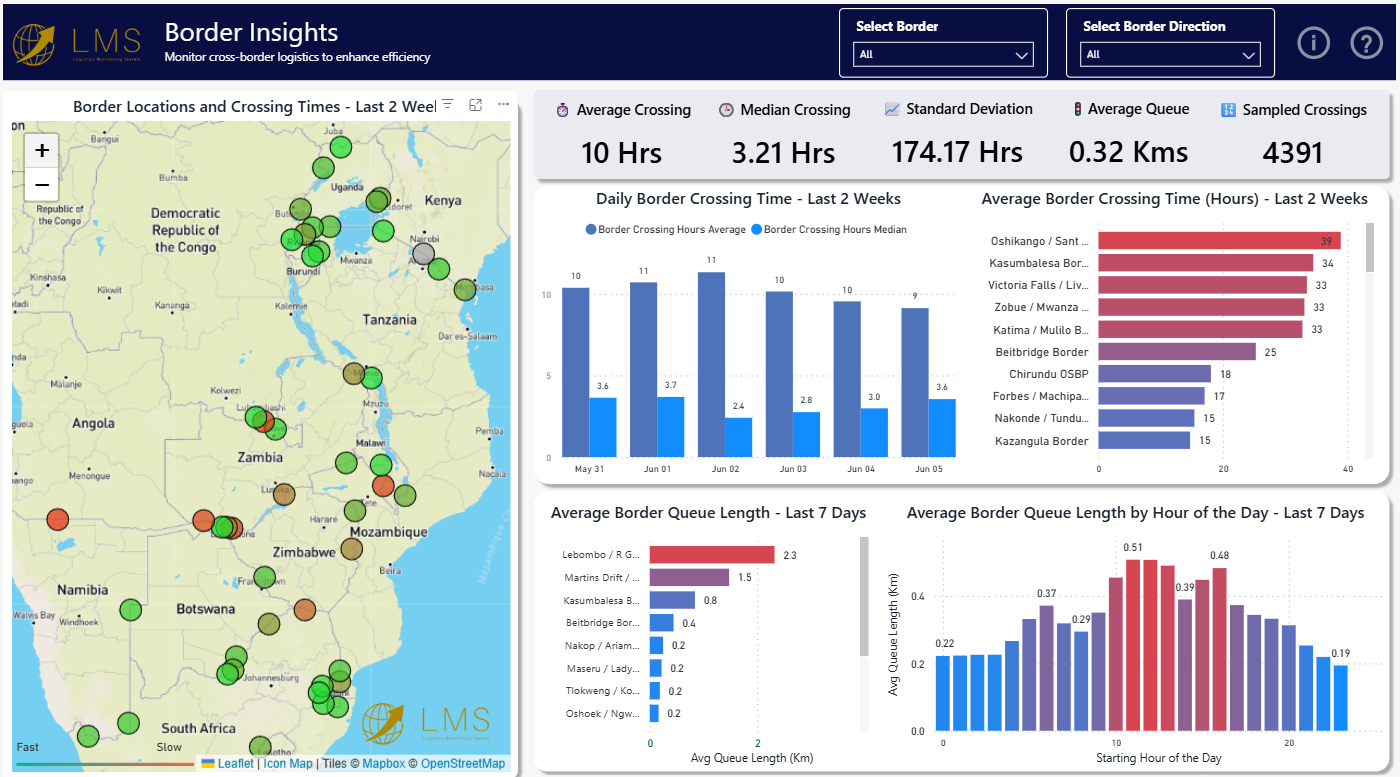
Border Insights
View Border Detail -
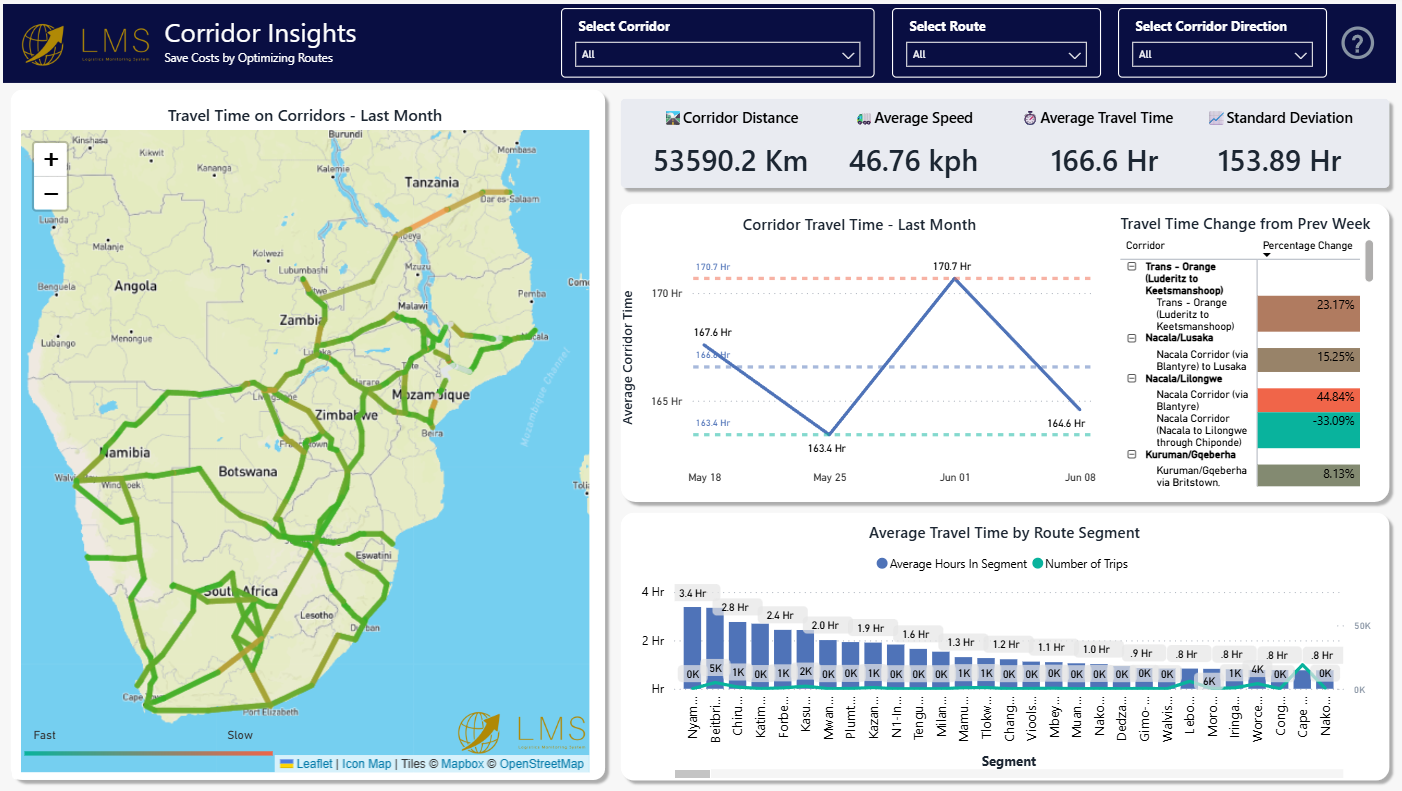
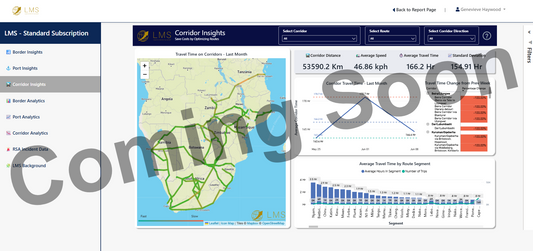
Corridors Insights
View Corridor Detail -
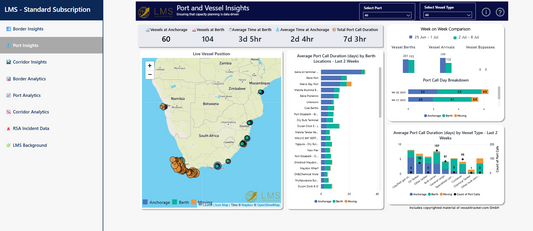
Port Insights
View Port Detail -
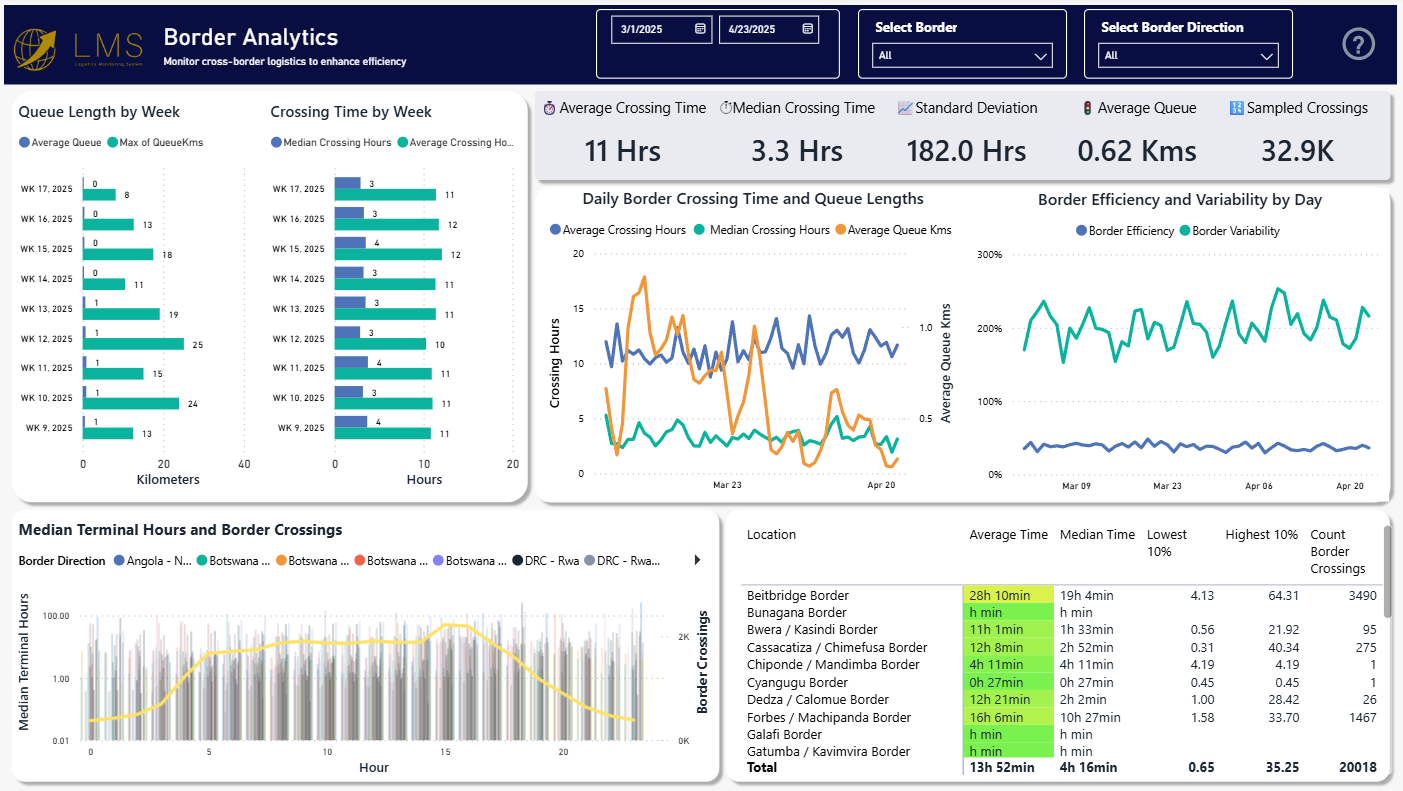
Border Analysis
See Border Analytics -
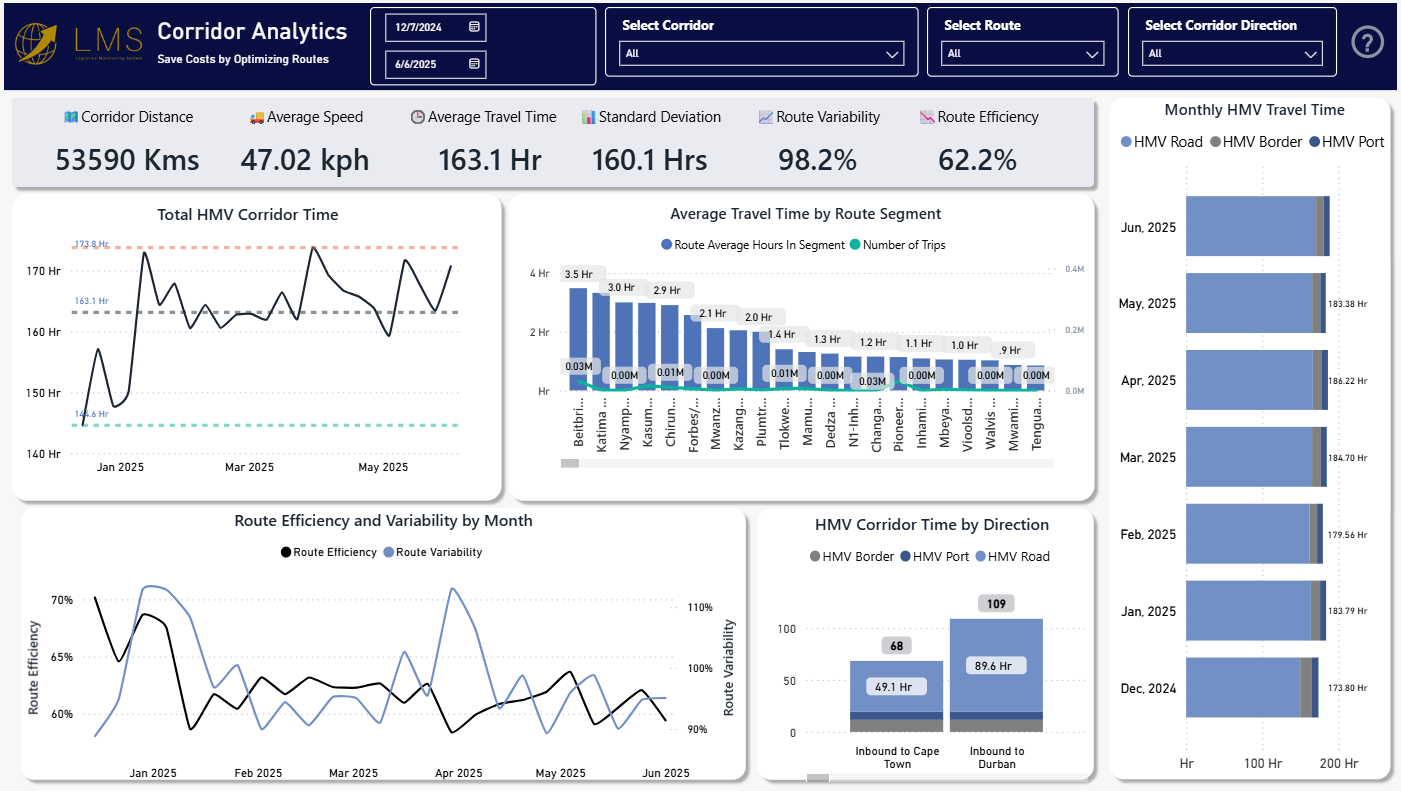
Corridor Analysis
See Corridor Analytics -
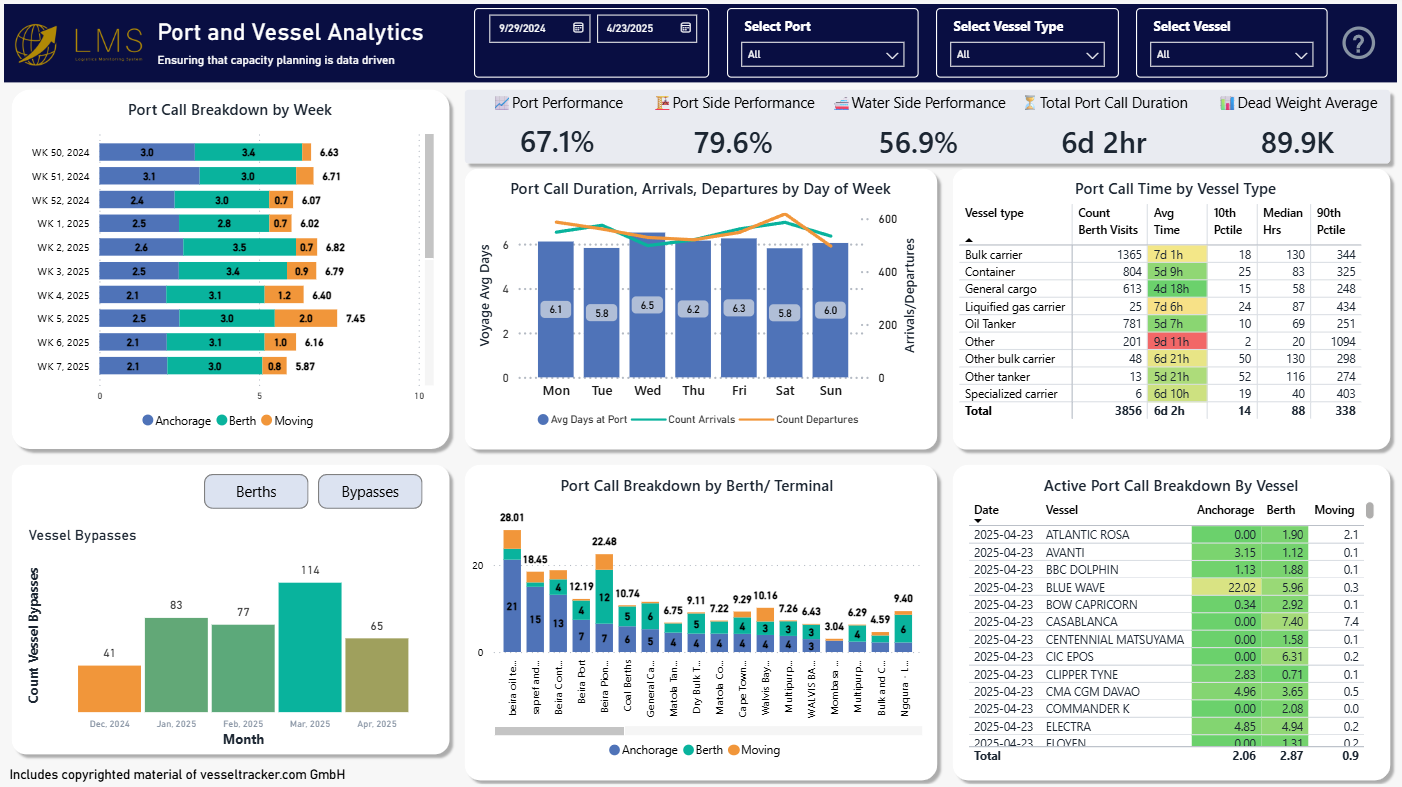
Port Analysis
See Port Analytics