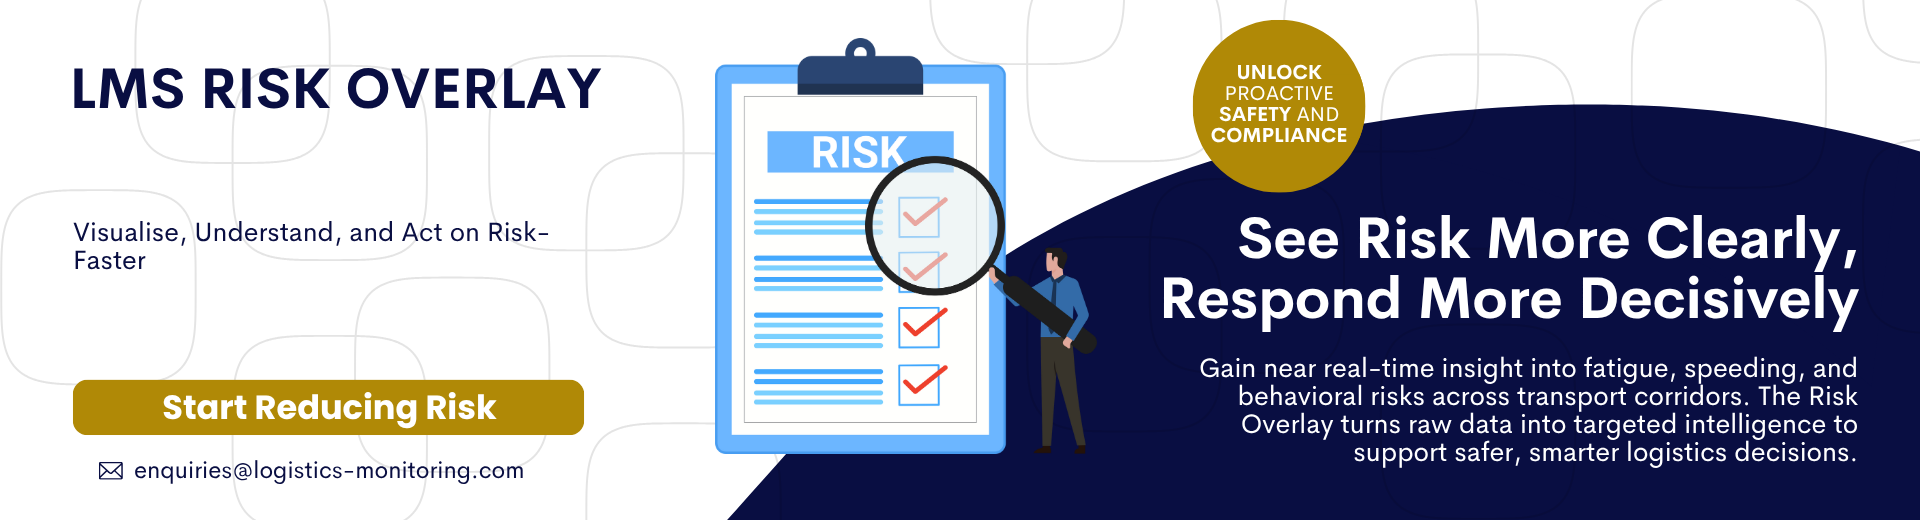
The LMS Risk Overlay is a powerful enhancement to your Logistics Monitoring System - designed to provide near real-time visibility into risk across key corridors and transporters. By analysing fatigue, speeding, and general driver behavior, the Risk Overlay empowers you to take targeted action that improves safety, boosts performance, and informs smarter decisions.
What is the LMS Risk Overlay?
The Risk Overlay is an interactive dashboard that highlights operational risk hotspots across your logistics network. It helps you quickly identify:
High-Risk Corridors That Require Urgent Intervention
Transporters With Recurring Risky Behavior
Types of Risk - Including Fatigue, Speeding, and General Inefficiencies
1 / of3
1 / of5
Why Use the Risk Overlay?
With the LMS Risk Overlay, you can:
Target interventions based on corridor-specific and transporter-specific risk.
Improve safety compliance through early detection of high-risk patterns.
Prioritise investments in infrastructure or training where risk is persistent.
Support enforcement decisions with clear, data-backed evidence.
Enable proactive planning by comparing current risk levels with past performance.
Use the Risk Overlay to:
Apply filters (e.g., date, corridor, direction) to isolate problems.
Compare your transporter data to industry benchmarks.
Pinpoint and address root causes-fatigue, speeding, or otherwise.
Track whether interventions are working through trend analysis.
Turn Risk Data into Action
Our Risk Overlay helps you spot issues fast, compare performance, and act with confidence.
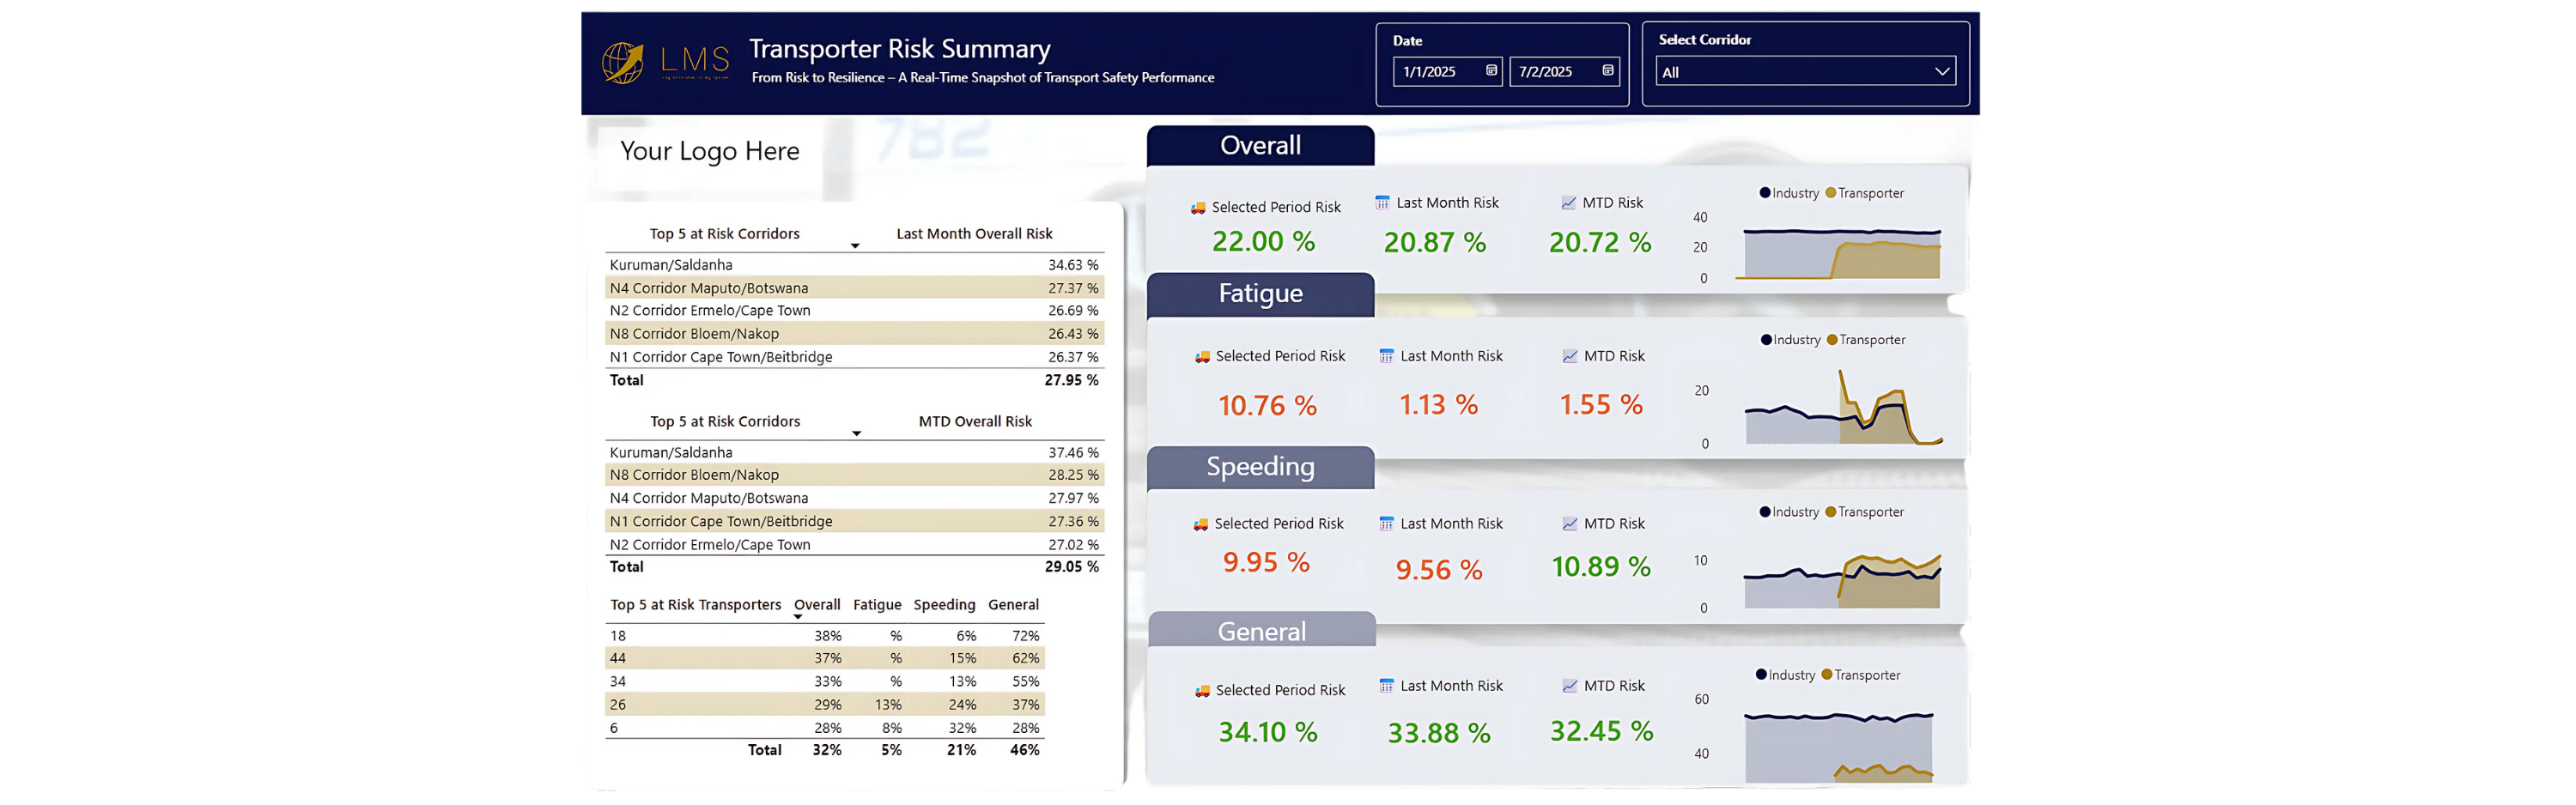
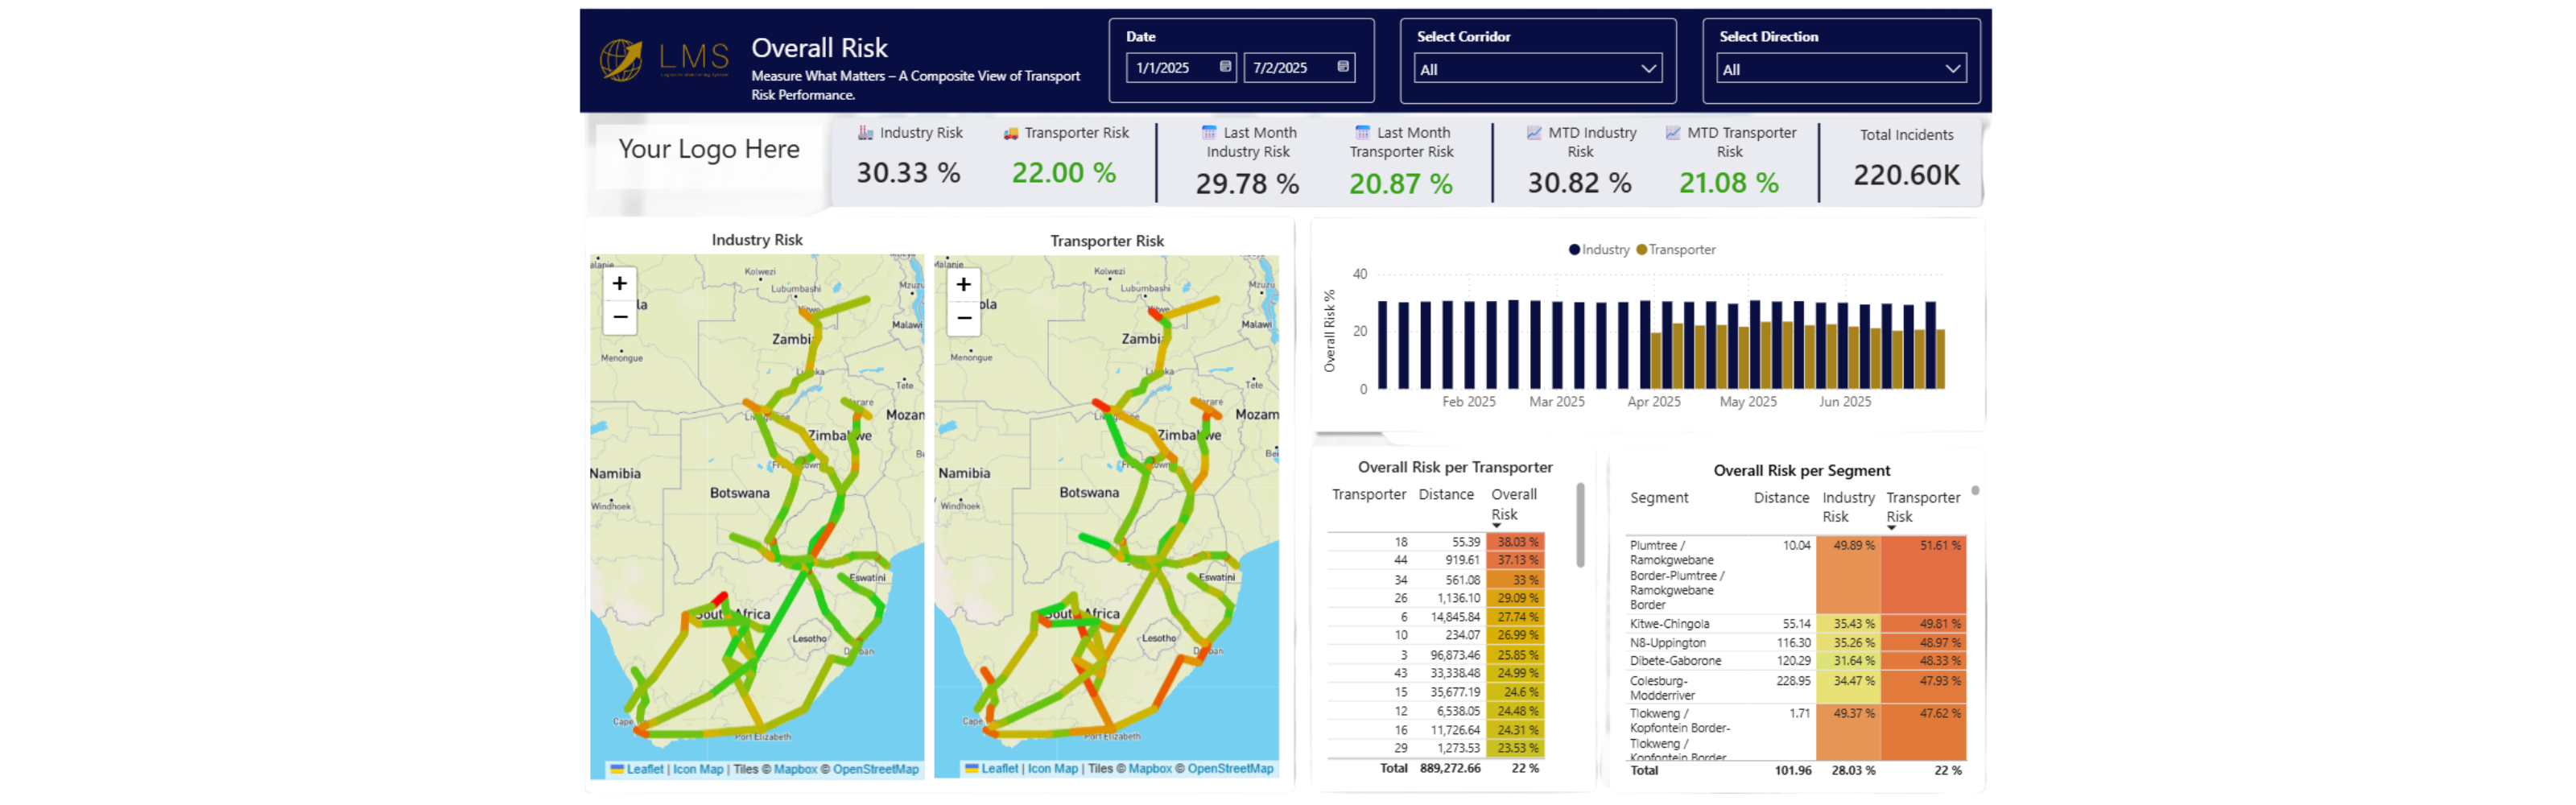
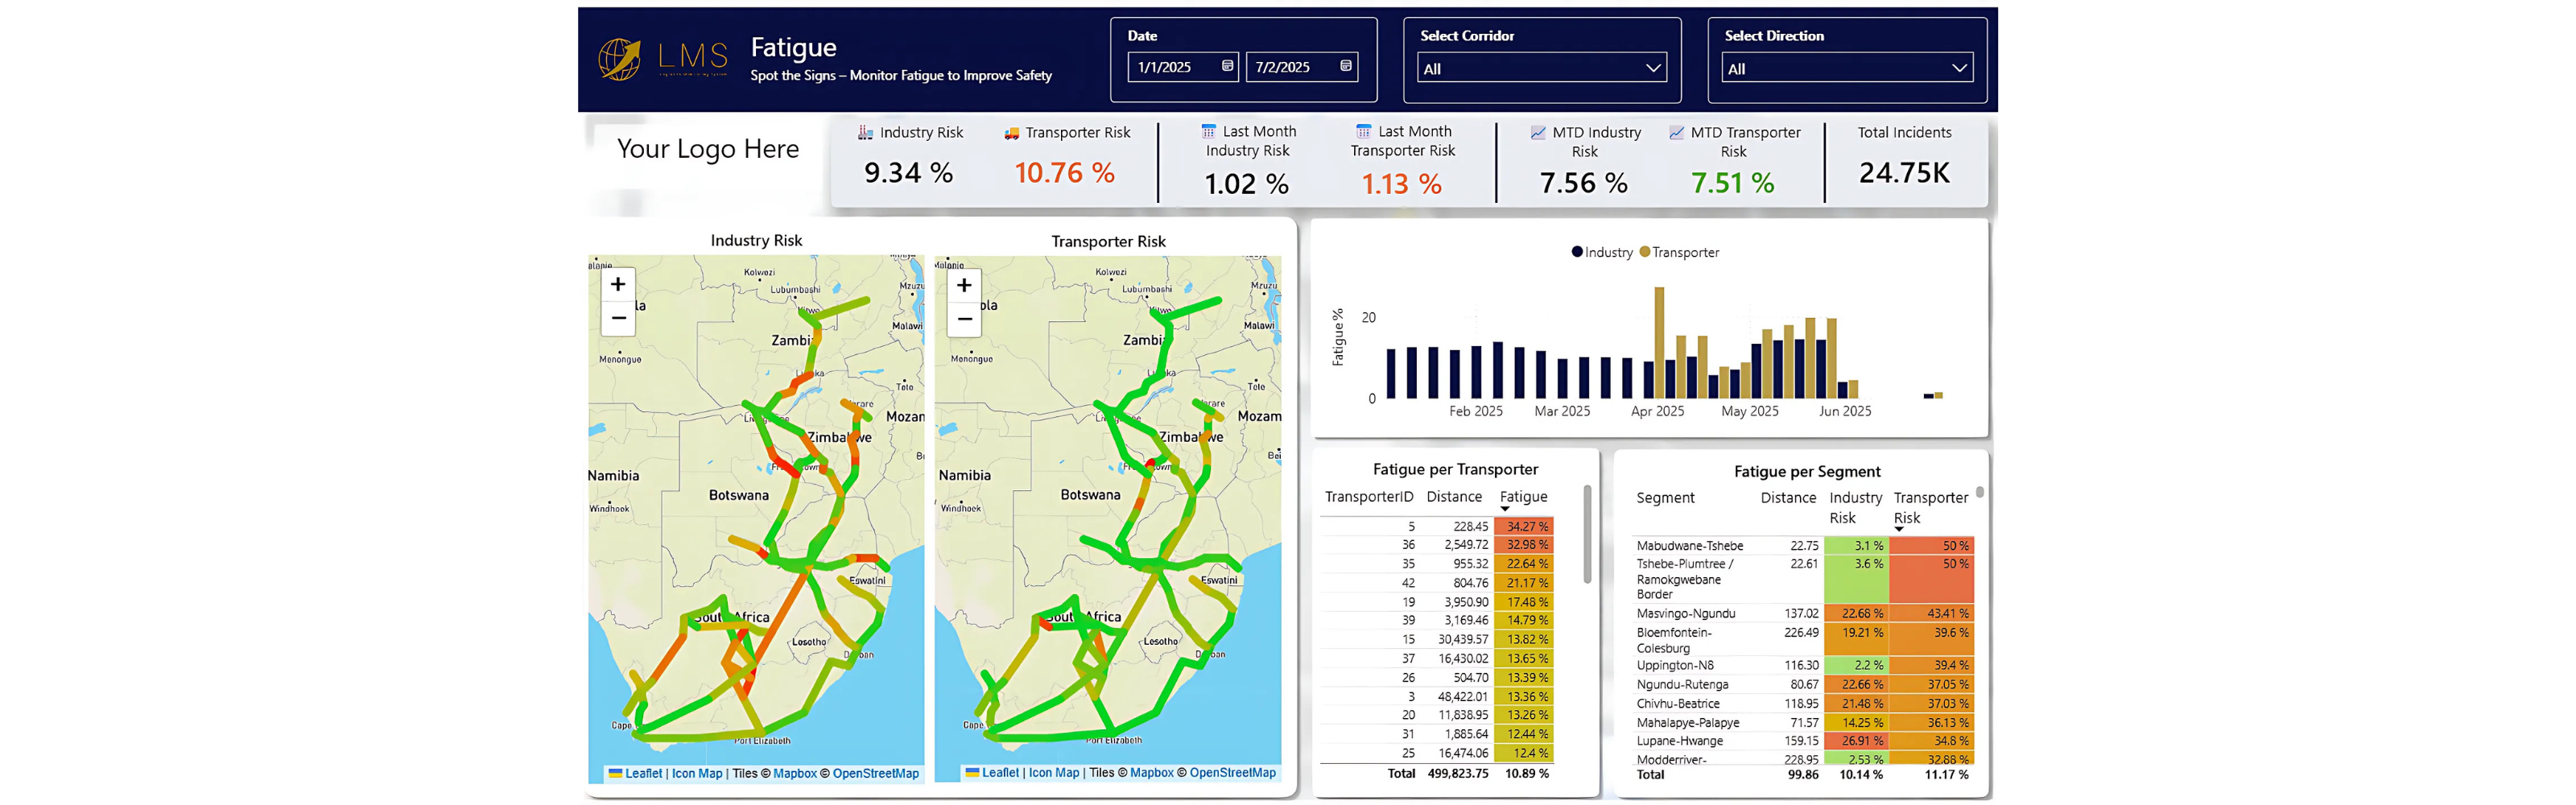
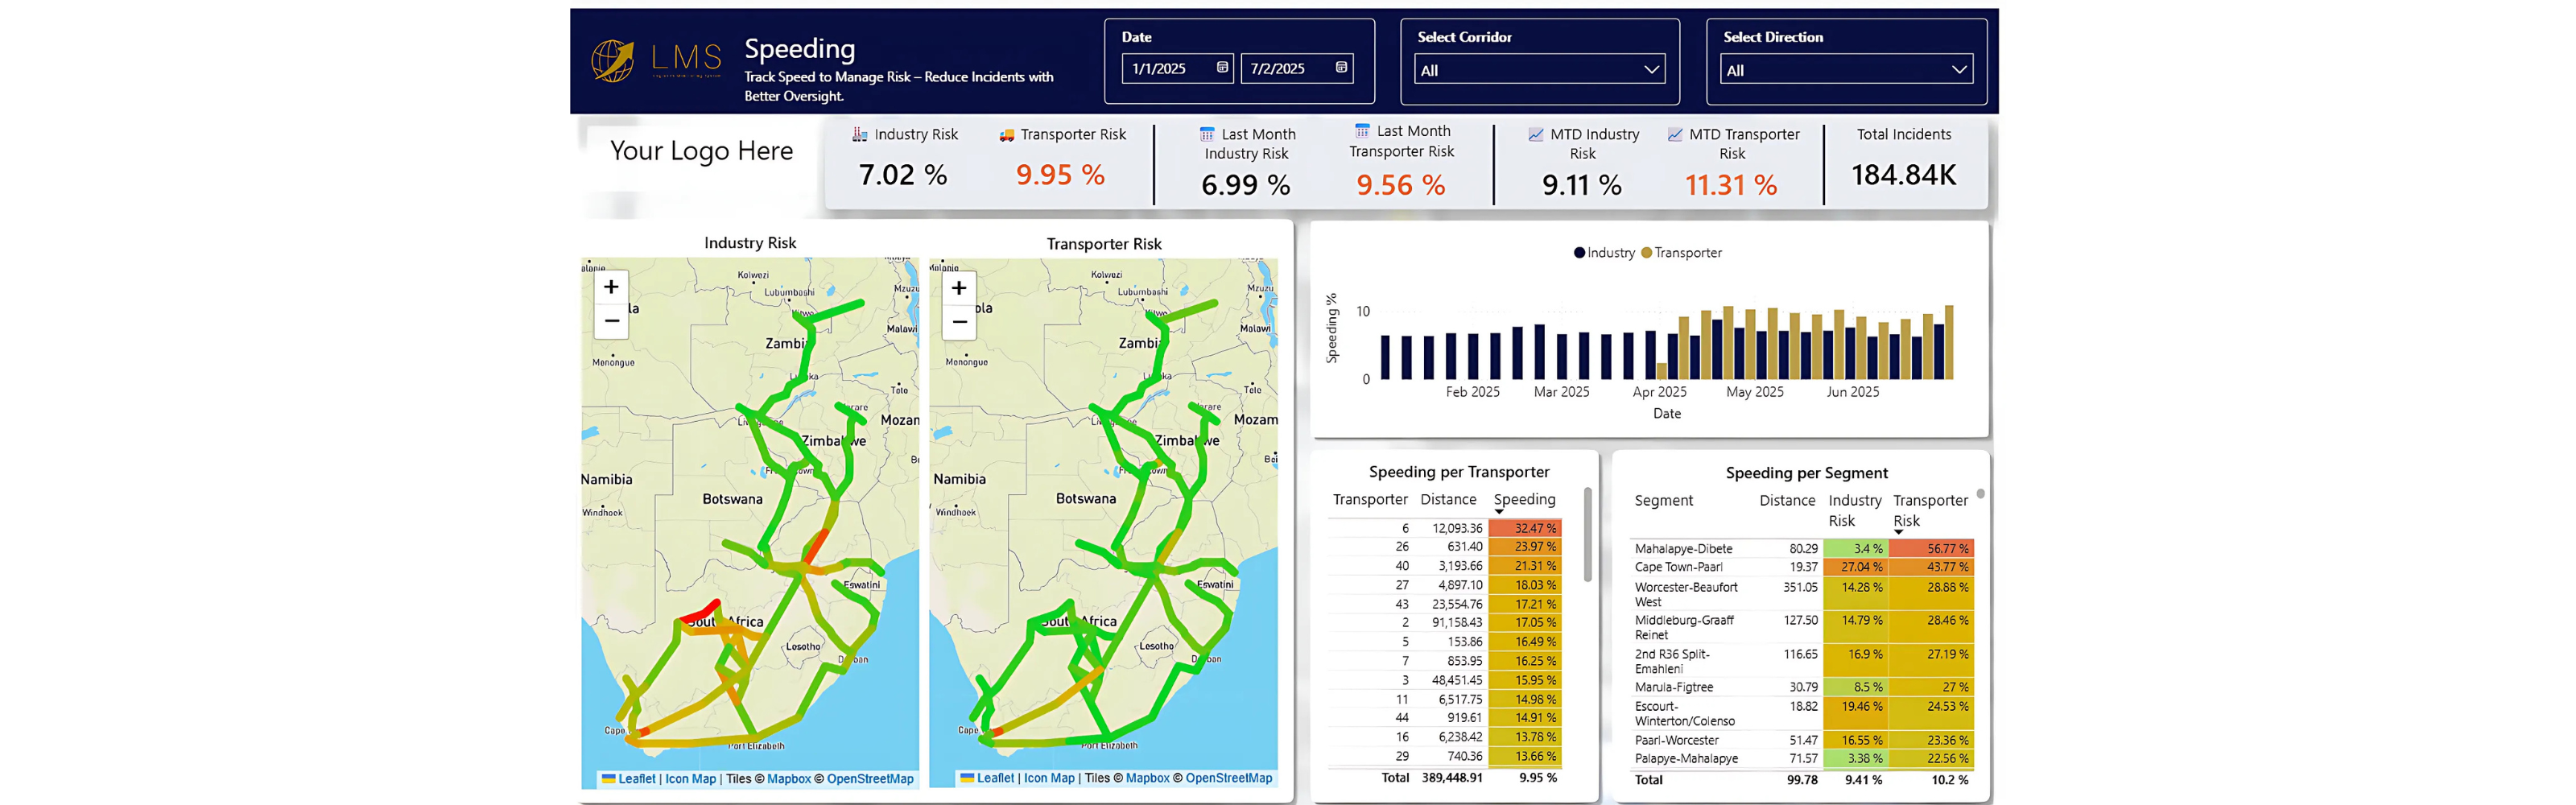
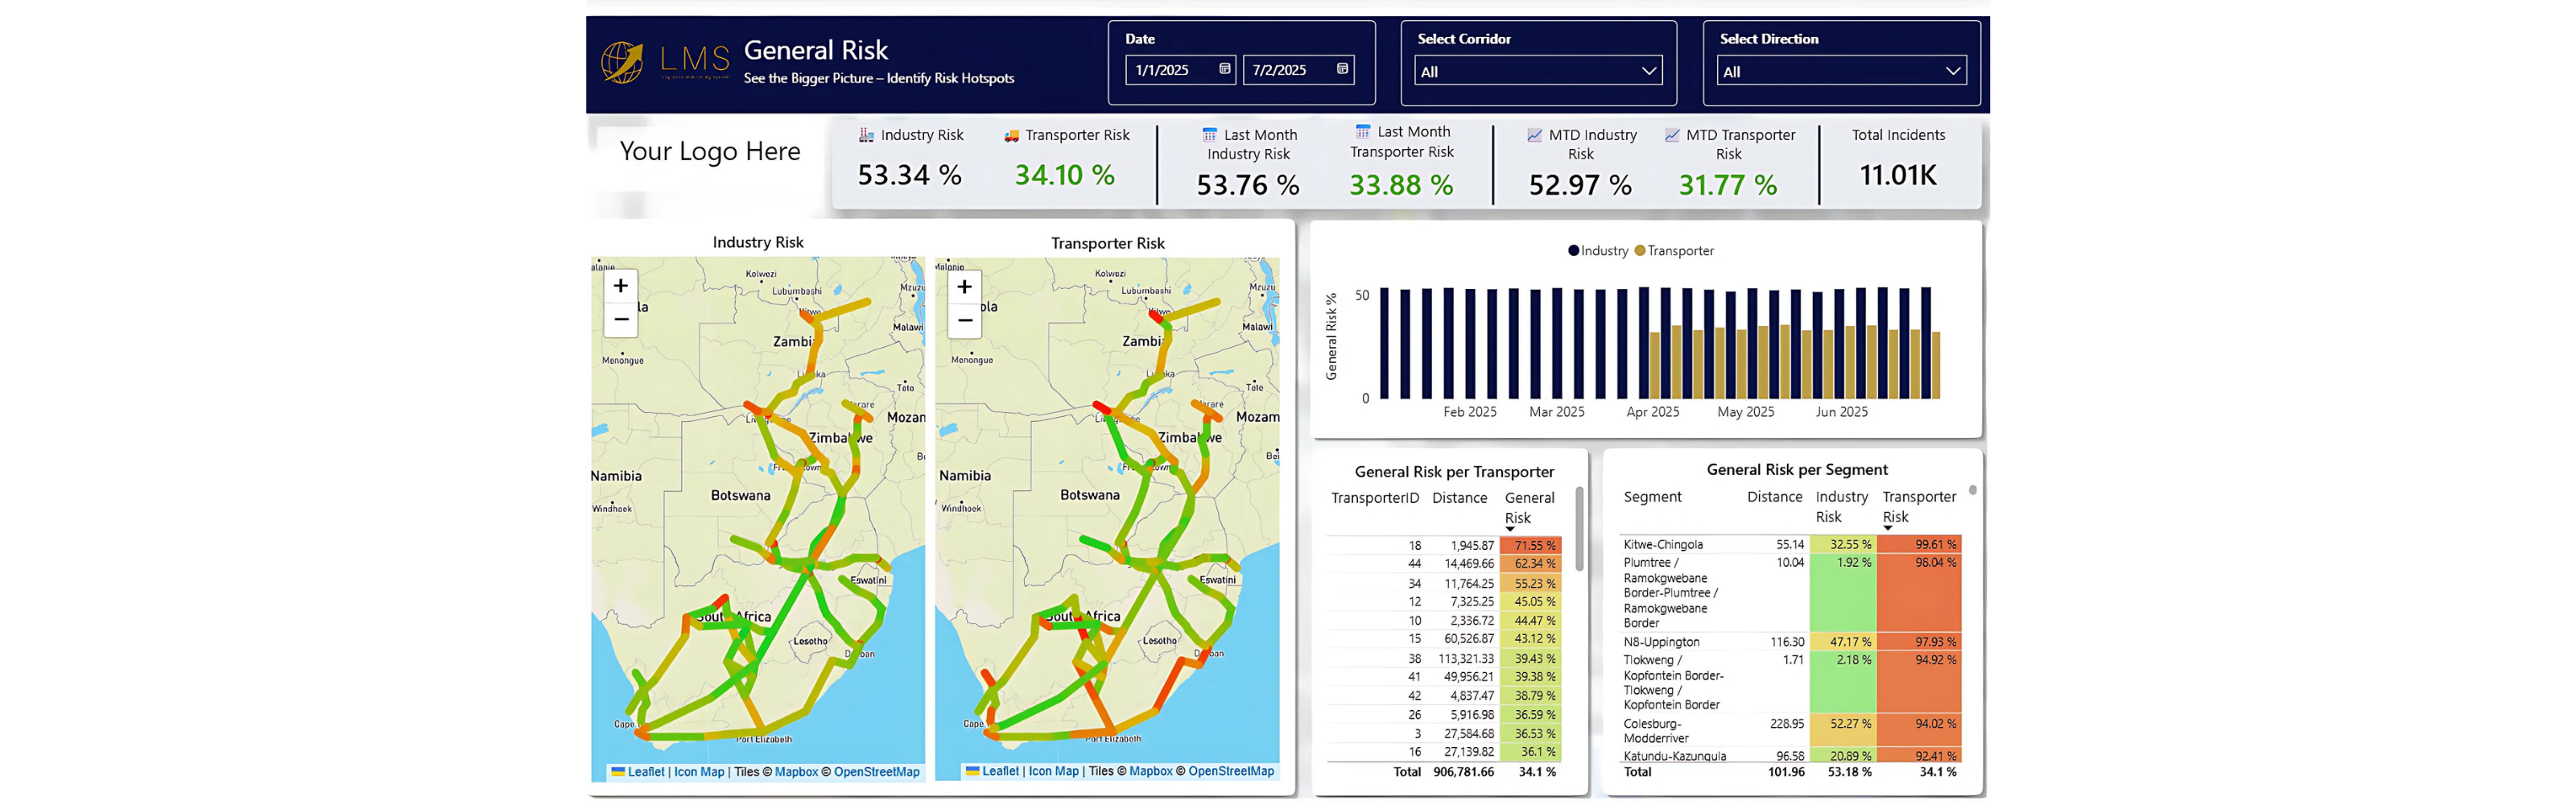
The Risk Overlay provides a structured, data-driven view of operational risk using weighted and normalised metrics across several key performance indicators. Each indicator highlights different dimensions of risk - enabling focused intervention and smarter decision-making.
Key Metrics Tracked:
Transporter Risk (%)
A weighted score based on risky driving events, normalised over distance or number of trips. This metric highlights transporters with consistently risky behaviour patterns.
Industry Risk (%) An average risk score across all transporters operating within a specific industry. This helps benchmark individual performance against industry norms. Overall Risk (%) A composite score that incorporates fatigue, speeding, general driving behaviour, and total incident counts - offering a holistic snapshot of corridor and transporter risk. Speeding (%) Calculated based on the average distance travelled at speeds exceeding 85 km/h for over 1 minute, this metric flags high-speed driving behaviour that could indicate elevated safety risks.
Fatigue (%) This score reflects the average distance driven continuously for over 4 hours without a stop longer than 15 minutes - highlighting risk from prolonged driving without adequate rest. General Risk (%) A representation of the top 80% of risky driving incidents (e.g., harsh braking, cornering, or acceleration), adjusted to account for environmental and operational conditions. Distance (km) Total kilometres travelled - used to normalise risk scores, making them comparable across companies and routes of different sizes. Total Incidents A count of all captured risky driving events - fatigue, speeding, and general behaviour - used to identify hotspots and trends in risk exposure.
Ready to Reduce Risk Across Your Supply Chain?
The Risk Overlay is available as an add-on to our LMS platform.
Contact our team to learn more about pricing, implementation, and how to get started.